


But what if we have another Great Depression?
Model the past to have more confidence in the future

Good morning,
Last week I wrote about different ways to “stress test” your retirement income plan to see how it might hold up in the future.
But another helpful perspective is to see how your retirement income would have held up in the past.
Especially during some challenging periods in our nation’s history.
My colleague, Derek Tharp, refers to this approach as “Historical Market Visualizations.”
Once again, let me be clear that the past is not prologue…
But it can provide another helpful point of view as we look at the resilience of your income plan throughout retirement.
We looked at Jane - a hypothetical client - and her income plan last week. Here’s the summary:
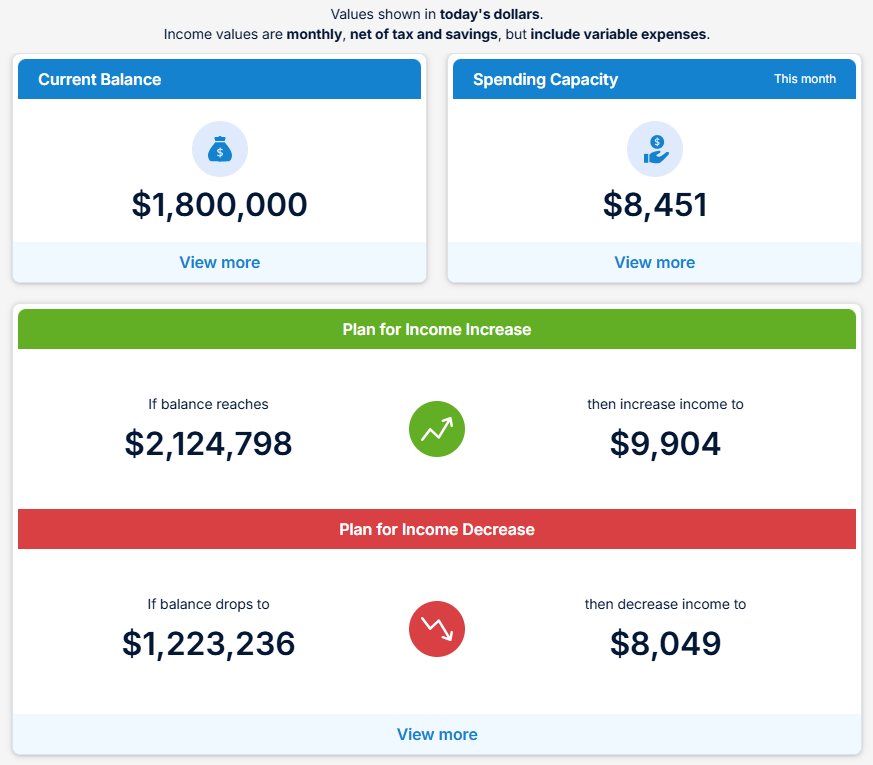
And we explored the pros and cons of different stress tests to evaluate how Jane’s income plan could hold up in the future, no matter what.
Now, let’s rewind the clock and see how Jane would have fared during the 2007-2009 Global Financial Crisis:
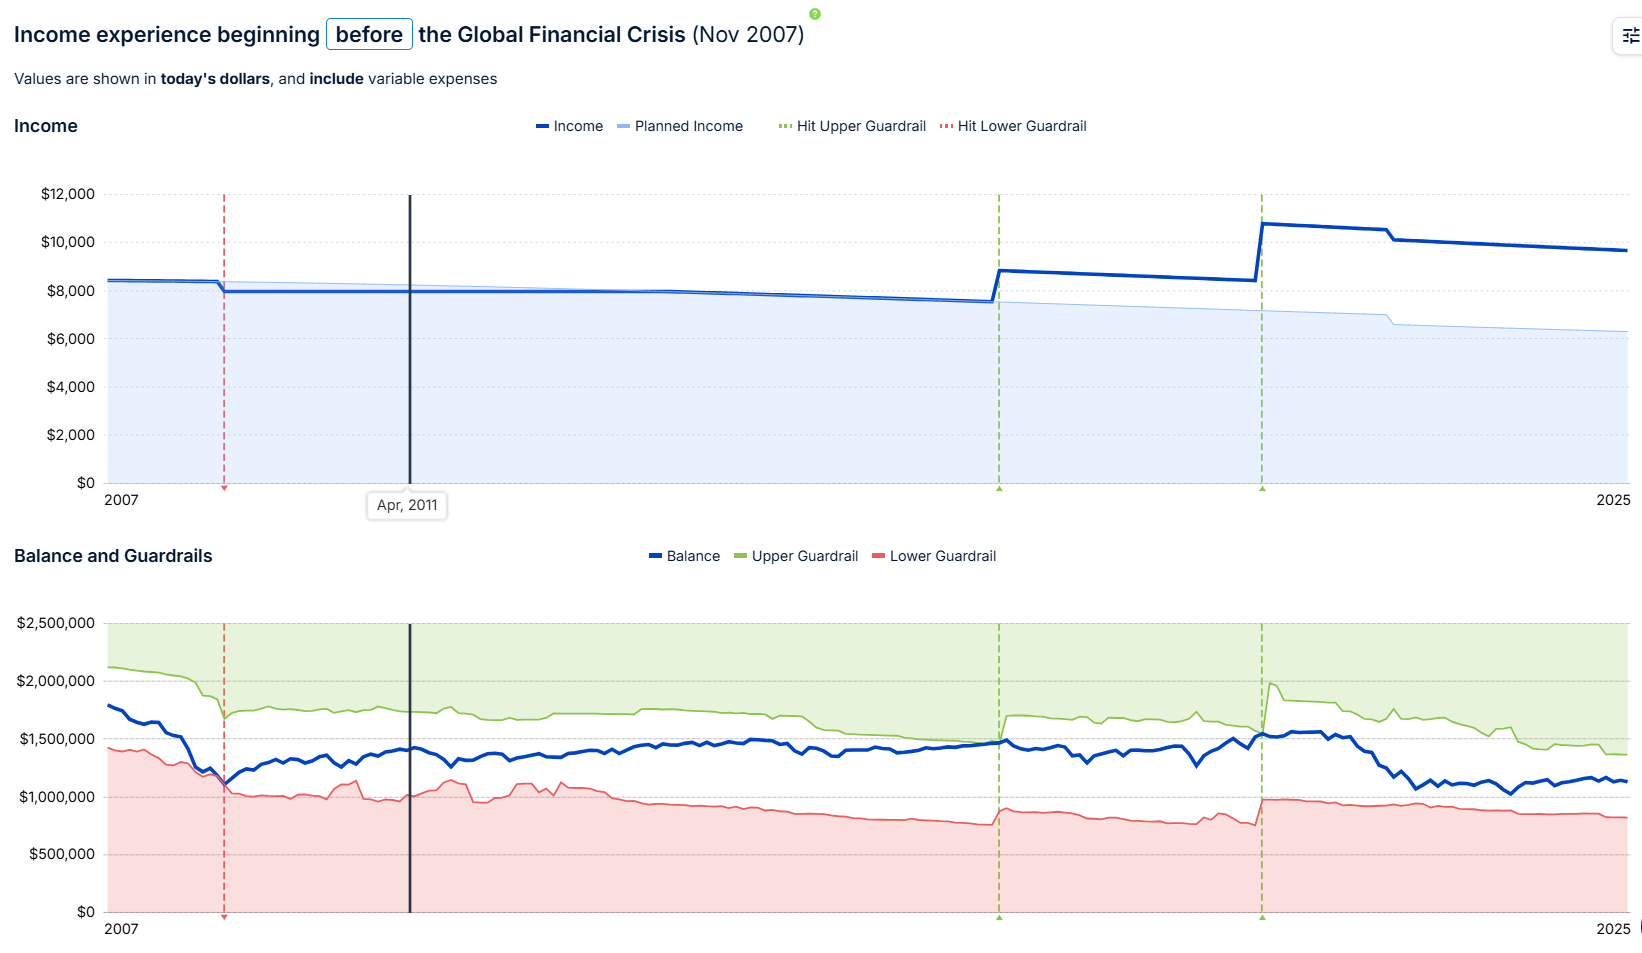
The chart above shows what would have happened to Jane’s retirement income had she retired in November, 2007.
The light blue shading shows Jane’s planned spending over time.
That first vertical red dotted line shows that in March, 2009, Jane would have to reduce her monthly spending by about $405 and maintain that spending level until January, 2018, when she could afford a monthly pay increase of $1,306.
And in January, 2021, she could have increased her monthly income once again by $3,617.
The bottom half of the chart above shows her income plan guardrails through time. You’ll see when the blue line (representing her portfolio value) touches the guardrails, it triggers an income adjustment.
Now, what if instead of retiring BEFORE the start of the Global Financial Crisis, Jane retired a year later, in November, 2008?
This would have been well into this crisis period.
Here’s what it would have looked like:
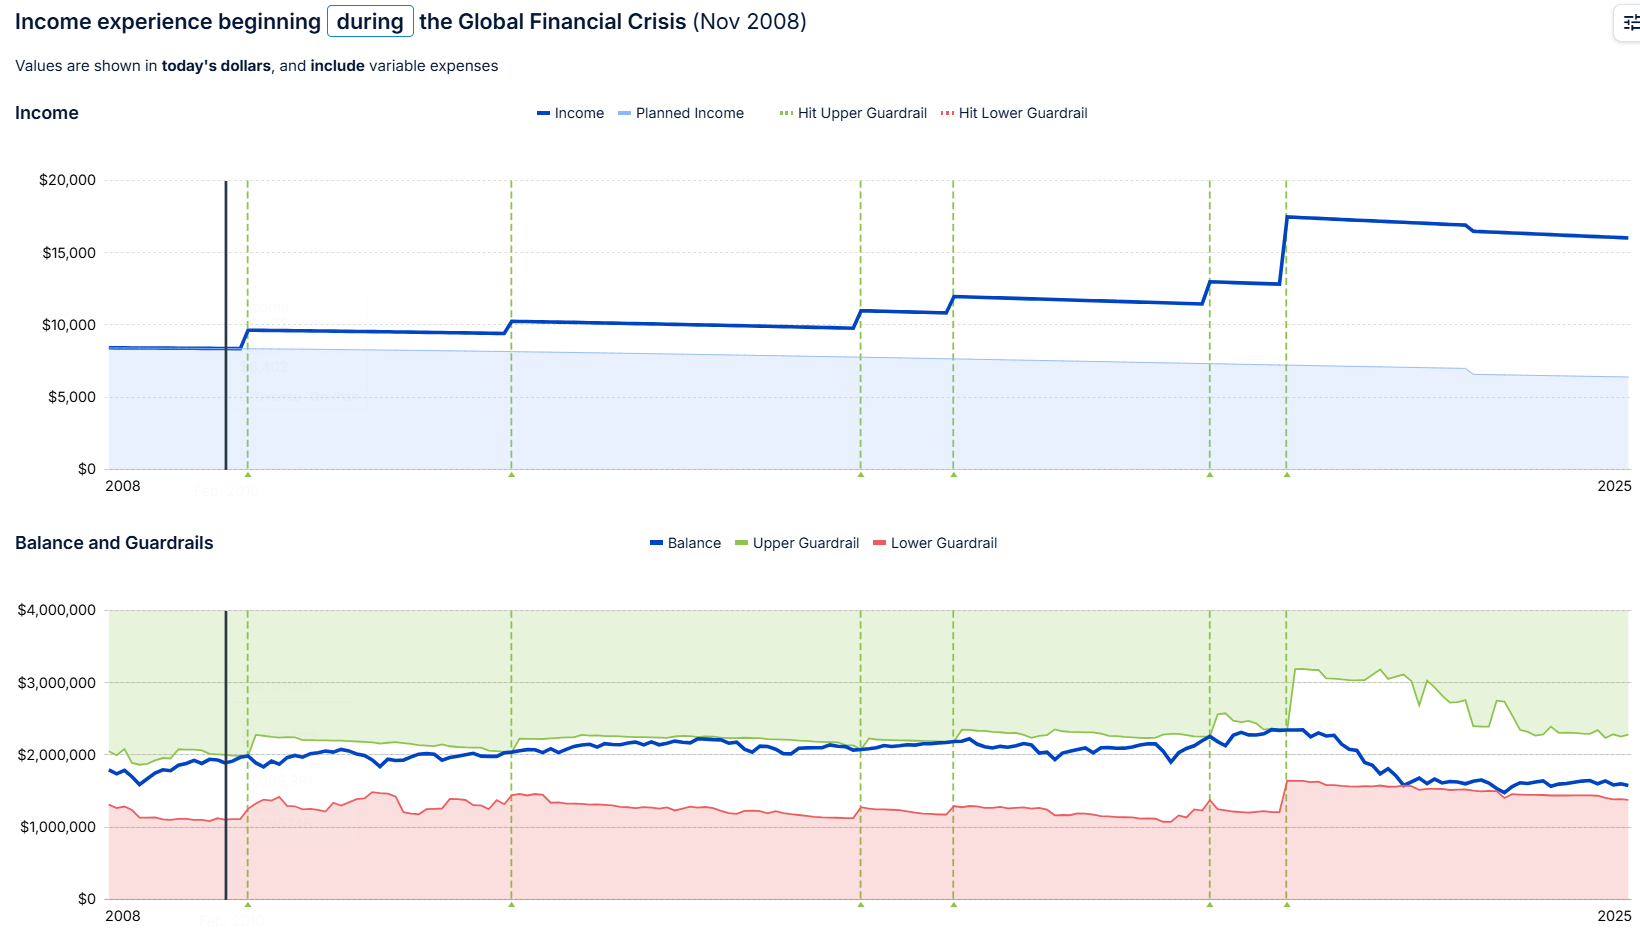
The multiple vertical green dotted lines above were all increases to her monthly retirement income.
What about retiring in March, 1999, before the Dot Com Bubble?

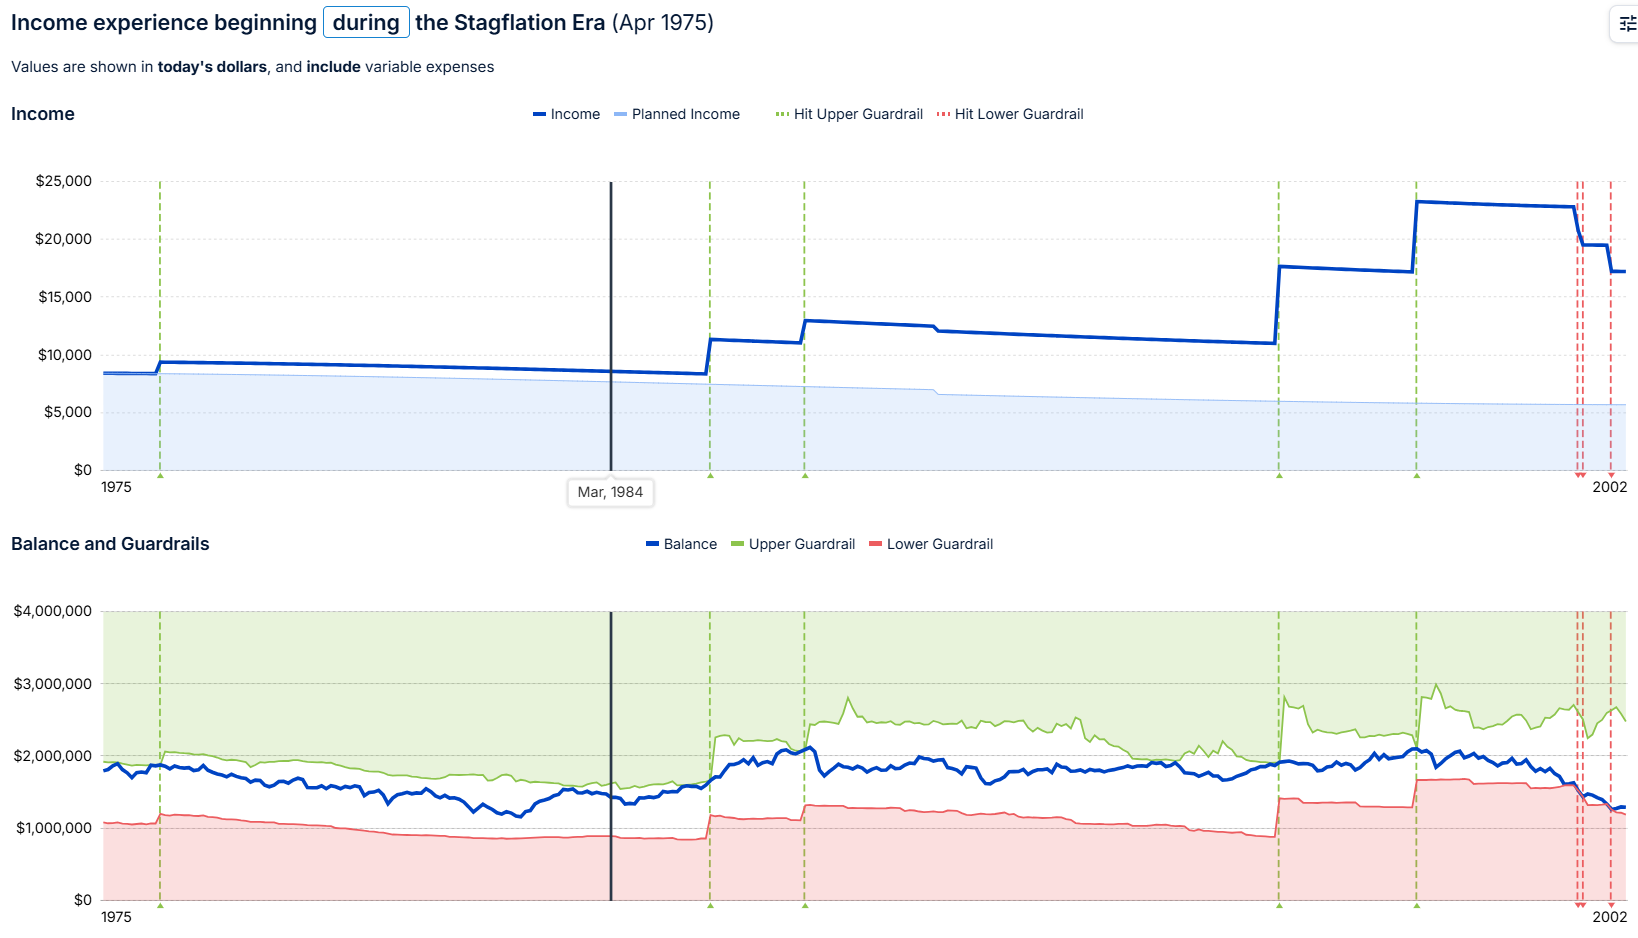
Or retiring in April, 1975, in the midst of the 1968-1982 Stagflation Era?
What if Jane had retired in October, 1950, in the middle of the Post-War Decade following World War 2?

And what if a widely-held worst fear happens and we experience another Great Depression?
Let me preface this with an excerpt from this article written by Derek Tharp:
This scenario reflects a retirement that began just before the Great Depression – arguably the most devastating economic time in modern American history. During this period, stock prices plummeted over 85% from 1929 to 1931, unemployment soared to 25% by 1933, and the economy experienced severe deflation averaging –6.5% annually from 1930 to 1933.
Many of us have parents or grandparents who lived through this era and whose lives were permanently shaped by the experience. Perhaps a grandmother who saved every piece of aluminum foil until her final days, or a grandfather who insisted on always maintaining a thoroughly stocked pantry with plenty of reserves even decades after the hardship had passed. These deeply ingrained habits reflect the psychological impact of living through profound economic uncertainty.
Here’s how Jane’s retirement income would have fared had she retired in April, 1929:

As you can see above, she had 2 successive income reductions in May and June of 1932, about 3 years after she retired.
But in March, 1936, she would have been able to increase her income to a level above her original planned spending.
She got another pay increase and then years later, another pay decrease while still maintaining spending above what she planned.
More from the Derek Tharp article:
While we plan for scenarios like the Great Depression because it represents a worst-case historical scenario, most retirements experience far more favorable conditions. In more typical market environments, these guardrails would likely trigger more frequent and substantial spending increases, allowing you to enhance your life in meaningful ways – whether that's additional travel, more time with family, increased support for the causes you care about, or whatever brings you fulfillment in retirement.
A couple of closing thoughts I’d like to share…
Your retirement income plan is unique to you and your situation.
How much of your retirement income is comprised of Social Security or a pension versus how much you’ll rely on your portfolio to supplement your lifestyle will impact your guardrails.
And your retirement income guardrails impact how frequently you’ll need to adjust your retirement spending (up or down) and the magnitude of these adjustments.
Your retirement income plan could look VERY different across these historical periods compared to what we’ve seen with Jane’s plan above.
Also, I have to regularly encourage some of my retired clients to spend more…
But they don’t because they’re worried about not having enough in the future.
They tell me - only half-joking - that they don’t want to wind up living off of cat food in their later years.
I’ve heard this cat food remark several times over the years from different clients.
Ultimately, it’s your money and it’s your decision.
But with the help of tools like I’ve shared above and in last week’s article, my hope is that you’ll feel more comfortable and confident in spending to a level that your situation can reliably support.
Now and in the future.
This additional spending can be for yourself.
Or for the people and organizations you care about.
It doesn’t have to be spent on a bigger house or more stuff to fill it.
Instead think of opportunities to share more experiences with family and friends. To create more memory dividends.
All of these stress-tests and Historical Market Visualizations are there to support you retiring on your terms and living the best life you can with the financial resources you have.
If I can help you evaluate - or reevaluate - your retirement income plan, please let me know.
Thank you for reading.
Until next Wednesday,
Russ