Good morning!
Today I want to share how I work with my clients to create a comfortable, confident, & sustainable retirement income plan.
This one will run a little longer than my usual weekly essay. So consider yourself warned! 😉
Let’s meet Jane Sample.
She’s 64 years old, single, and if the name didn’t give it away, Jane isn’t real.
What follows is a hypothetical client case study, though it’s a good representation of the work I do with women (and their families) as they prepare for and transition into retirement.
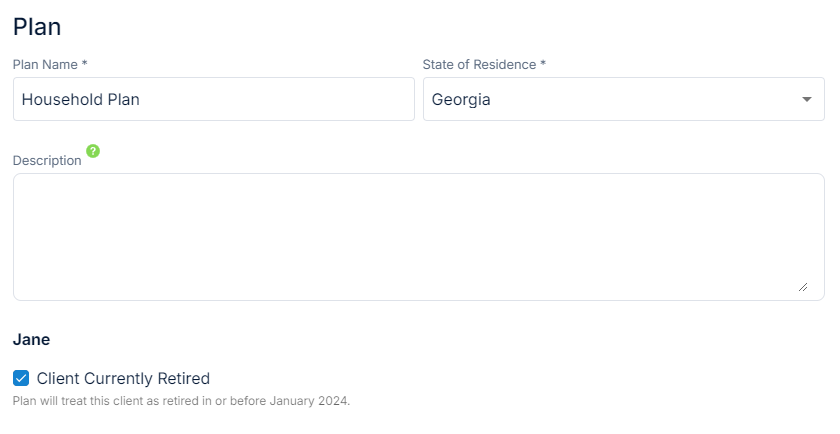
Jane lives in Georgia and retired in late 2023.
Note: you can click any of the images to see a larger version.
Let’s go through Jane’s current finances…
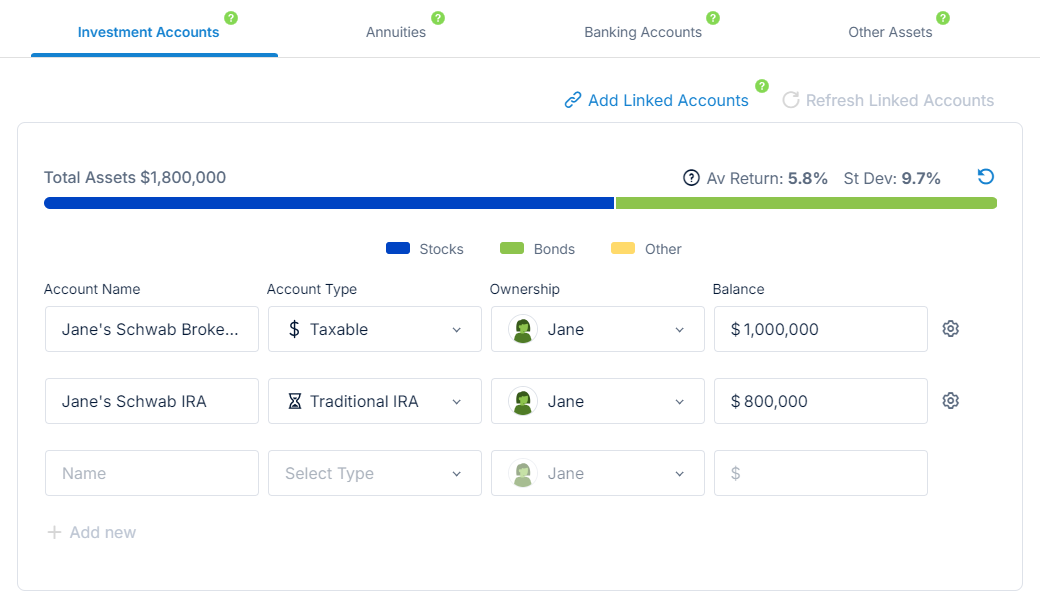
Here are her 2 investment accounts:
Note: Jane’s taxable brokerage account above (worth $1,000,000) has a total cost basis of $600,000 (these details aren’t shown above). This means if she liquidated her entire account today, she’d owe capital gains taxes on the $400,000 difference.
And while we certainly aren’t going to liquidate her entire account at one time, the cost basis and embedded tax liability are being accounted for in the background throughout the analysis that follows.
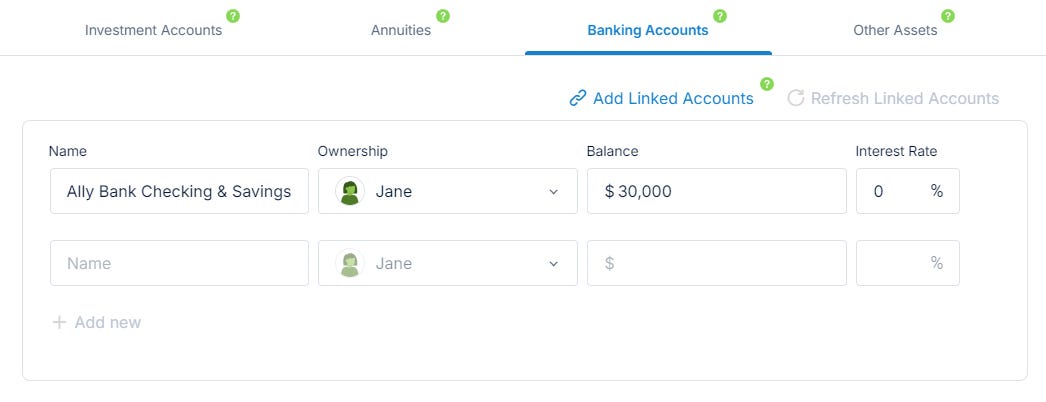
She also has checking and savings accounts at Ally Bank:
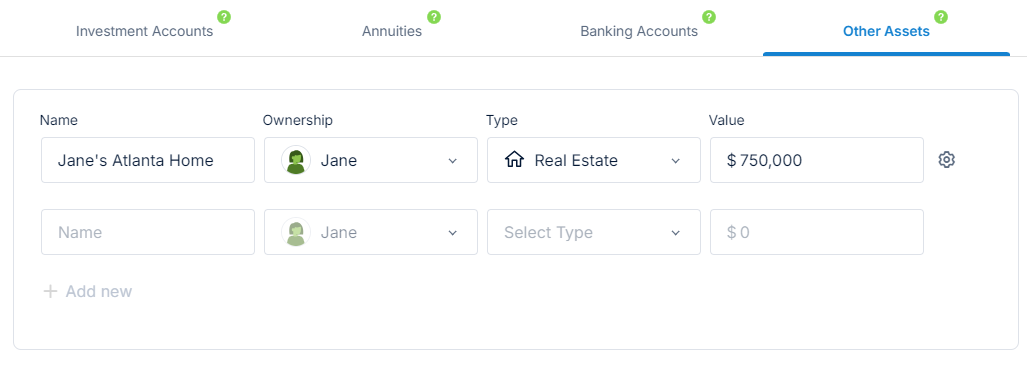
And she owns her home in Atlanta and has no mortgage:
Note: Jane’s Ally Bank accounts and her home equity aren’t being utilized in the analysis below. We’re only looking at her 2 Schwab investment accounts and her sources of income.
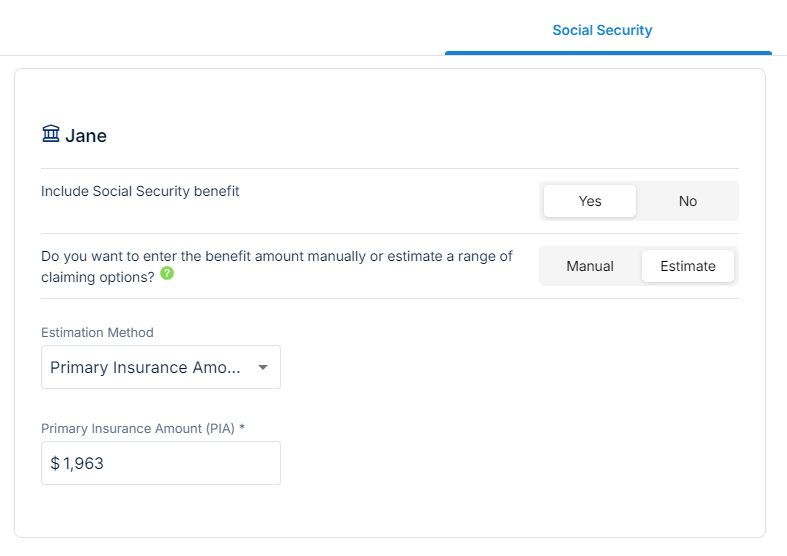
Speaking of income, Jane is eligible for Social Security though she hasn’t started receiving benefits yet:
Her “primary insurance amount” above is the Social Security benefit she’s entitled to receive monthly starting at her “full retirement age” (FRA) which for her is age 67.
FRA is set by the Social Security Administration and is based on your date of birth.
You can start your Social Security benefits before your FRA (as early as age 62 in most cases), but at a reduced benefit amount.
Or you can delay the start of your Social Security benefits up to age 70. Every year you wait past your FRA, you’ll get approximately 8% added to your FRA benefit amount.
In this case study, we’re assuming Jane will start her Social Security benefits at age 67.
Jane doesn’t have any other sources of retirement income.
But if she were receiving a pension, expected an inheritance, or was working part-time, we would enter those amounts and their corresponding tax treatment in her plan here:
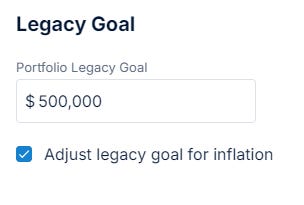
Jane also wants to leave $500,000 (in today’s dollars) from her investment portfolio (not including home equity or bank accounts) behind to her daughter/grandkids at the end of her life expectancy (more on that in a bit).
OK, we’ve covered Jane’s assets and income sources.
Now let’s address her expenses.
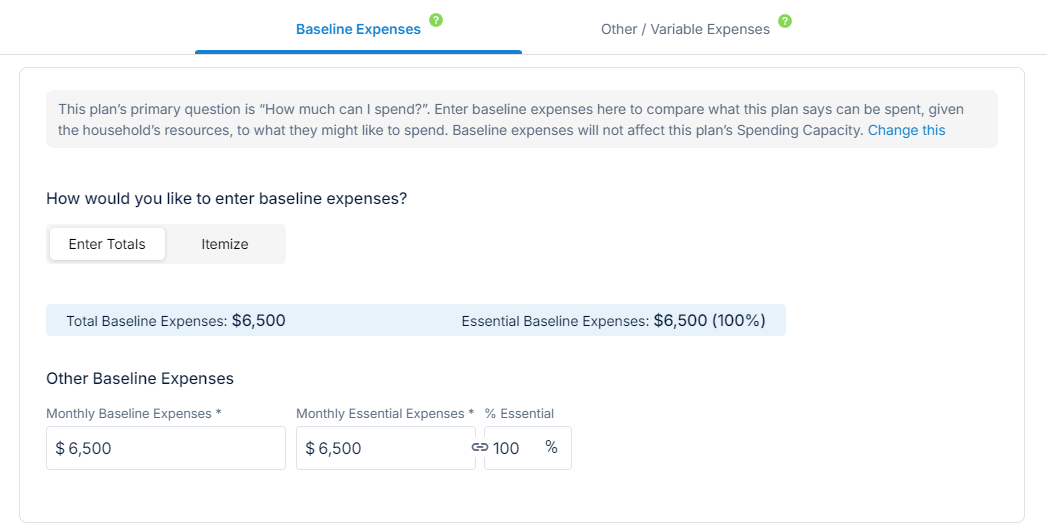
Jane anticipates spending an average of $6,500 per month in retirement which we’ve accounted for as her “baseline expenses” below.
This monthly number represents her cost of living including groceries, bills, insurance, property taxes, putting gas in her car, dining out, gym membership, Netflix, and everything else she needs to live her life.
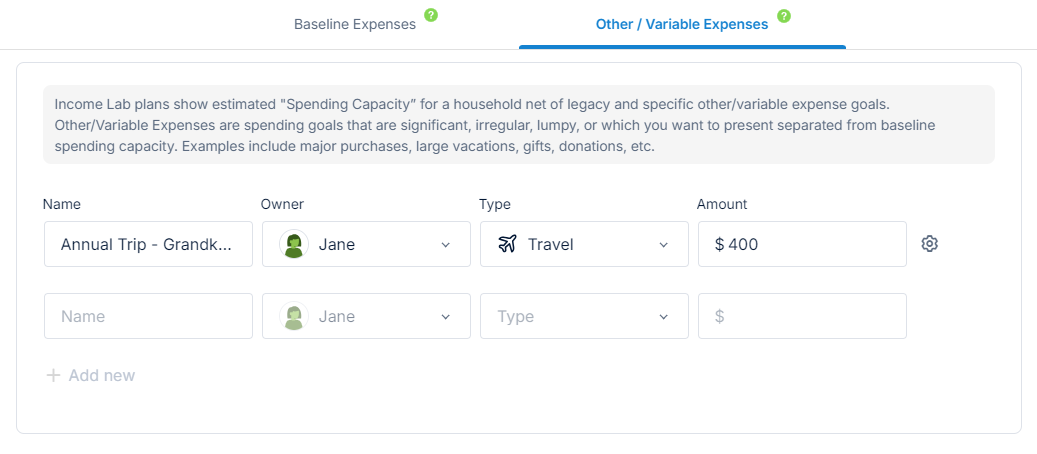
In addition to her baseline expenses, she plans to travel once a year to visit her daughter and grandkids on the west coast.
Her annual trip will cost approximately $4,800 and we’re spreading that cost out at $400 per month as a “variable expense.” This is in addition to her $6,500 monthly baseline expenses.
Sure, we could have just added another $400 to Jane’s baseline monthly expenses, but many clients like to separate out or “itemize” things like travel which gives us another variable we can adjust in the plan when exploring different decisions and trade-offs.
That’s pretty much it for Jane’s current financial picture.
However, we have the ability to add additional details like liabilities, savings, and/or insurance if it’s relevant to your personal retirement income planning.
As I mentioned above, Jane is currently 64 years old.
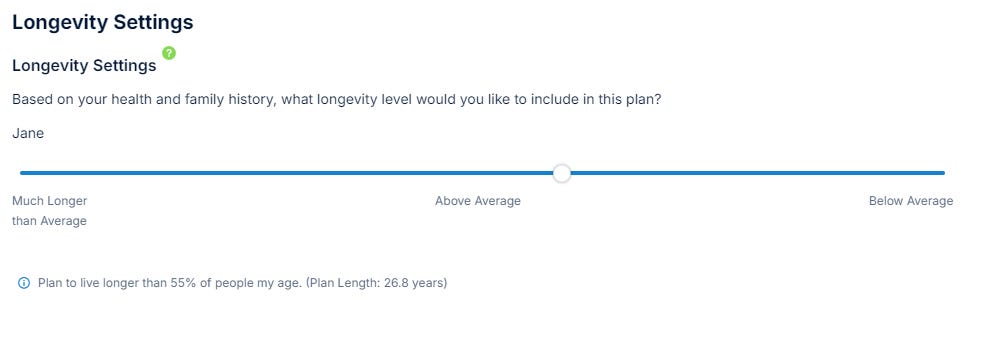
And based on my hypothetical conversation with this hypothetical woman, we’ve set her hypothetical life expectancy accordingly:
The graphic above shows that based on Jane’s preferences - or perhaps her family medical history - she’s comfortable assuming a life expectancy of approximately 91.
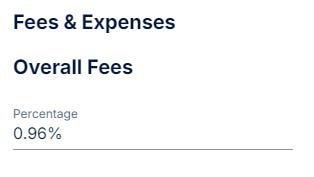
My fees - based on Jane’s 2 Schwab investment accounts - are factored into this analysis as well:
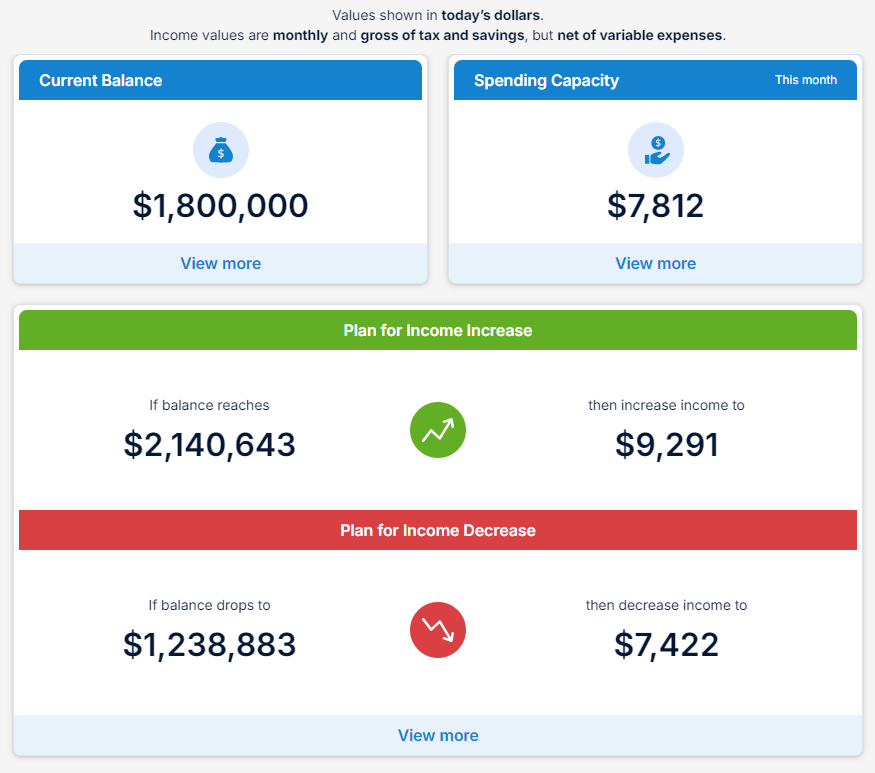
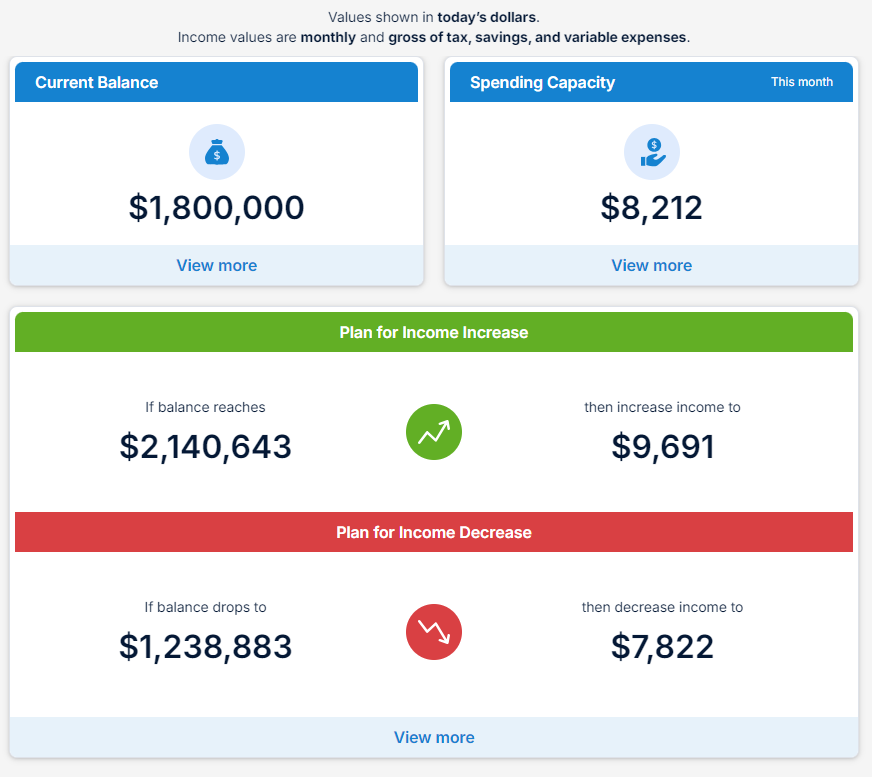
So accounting for Jane’s age, her life expectancy, her assets, her income, and her planned expenses, and my fees, here’s a concise, one-page overview of her retirement income plan:
What the image above tells us is that Jane’s current portfolio is worth $1.8 million between her brokerage account and her IRA. You can see this in the upper-left blue box.
Her monthly spending capacity for this month is $7,812 as shown in the upper-right blue box. This monthly figure is pre-tax, and doesn’t include Jane’s annual trip expense to visit the grandkids.
I have the ability in this tool to show these figures as annual instead of monthly or after-tax instead of pre-tax. I can also show spending capacity with or without variable expenses added in, as you’ll see in a moment.
And the green and red sections are important as they show how much Jane’s investment portfolio would have to rise or fall before we’d be need to discuss a potential increase or decrease to her monthly spending amount.
Remember from above that Jane said she wanted to spend $6,500 per month.
This analysis shows that she can afford to spend $7,812 monthly, or about $1,300 more per month.
Of course, this isn’t always the case.
Sometimes I have to tell my clients to rein in their spending expectations.
Regardless, it’s important to know what you can afford to spend.
And these “guardrails” demonstrate not only that we’ll have to make adjustments in the future, but it shows the potential magnitude of these adjustments.
As I’ve written before, you always have choices.
And these spending guardrails can help guide our choices, acting sort of like a “financial GPS” to keep you on the best route toward your goals while helping avoid problems along the way.
For example, Jane’s portfolio would have to drop in value by approximately 31% (from $1,800,000 to $1,238,883) before we’d need to adjust her spending.
But her associated spending cut wouldn’t also be 31%.
It would be only a 5% reduction, or about $390 less per month.
And Jane’s portfolio were to go up by about 19% and exceed $2,140,643, she gets a pay raise.
Her income could go up by about $1,480 per month, or a 19% increase.
If we look at the same retirement income plan, but add in Jane’s annual trip to visit her daughter and grandkids, it looks like this:
You can see that it adds the $400 per month travel expense to Jane’s monthly spending number in the top-right blue box. It also adjusts her spending guardrails as well.
This demonstrates that Jane can afford to spend about $1,700 per month above her monthly baseline spending needs of $6,500.
Or she can spend about $1,300 above her monthly spending need of $6,900 which includes the cost of her annual trip to visit the grandkids.
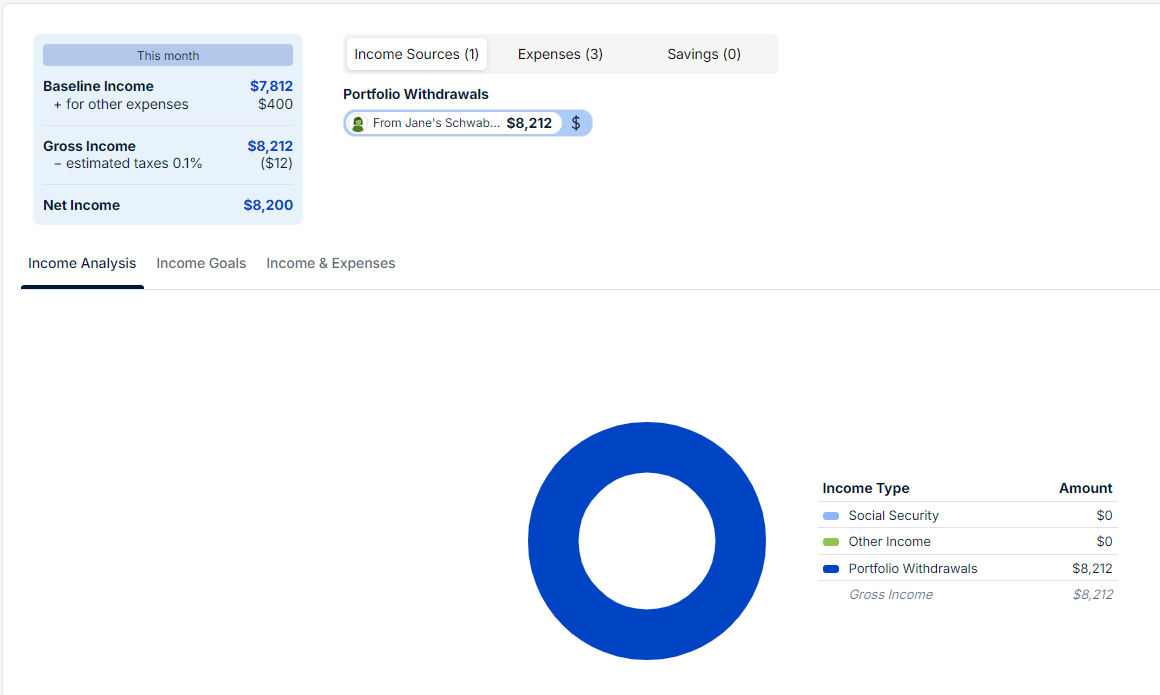
Here’s how we’ll provide Jane’s income this month:
As you can see above, we’ll fund her entire monthly spending need from her taxable Schwab brokerage account.
And while there will likely be some capital gains taxes associated with this monthly income, it’s far better than paying income taxes.
Jane hasn’t started her Social Security benefits yet, so her investment portfolio will be funding her entire income need for now.
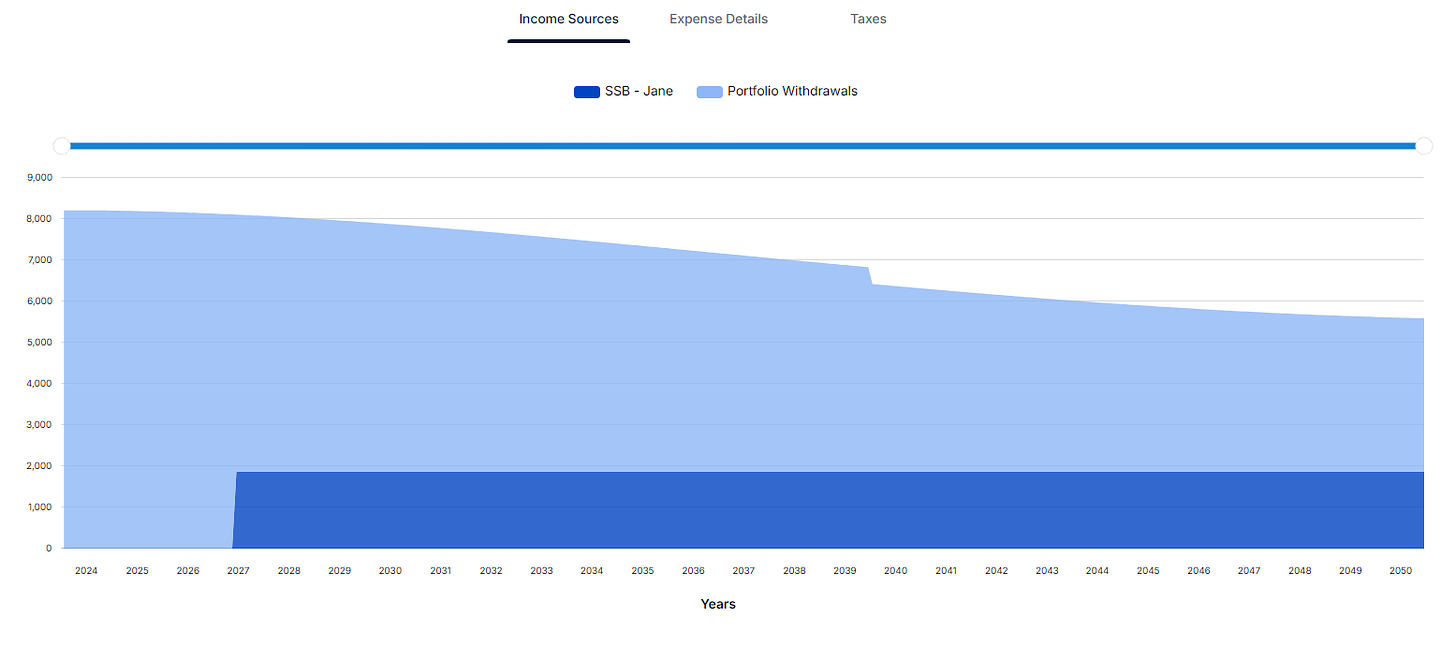
Here’s what her income sources will look like over time based on what we know today:
You can see above that Jane’s portfolio withdrawals (in light blue) will fund her lifestyle for the next few years. Then once her Social Security (in darker blue) starts in about 3 years, we’ll still be relying on her portfolio but the amount will be offset by her Social Security income.
You’ll also notice the slight dip in the light blue amount in about 15 years. This reflects Jane stopping her annual trip to see the grandkids when she’s about 80 years old.
She figures she probably won’t want to take a cross-country flight each year at that age. And she recognizes that her grandkids will be involved in their own interests and activities as they get older.
So we’ve planned accordingly.
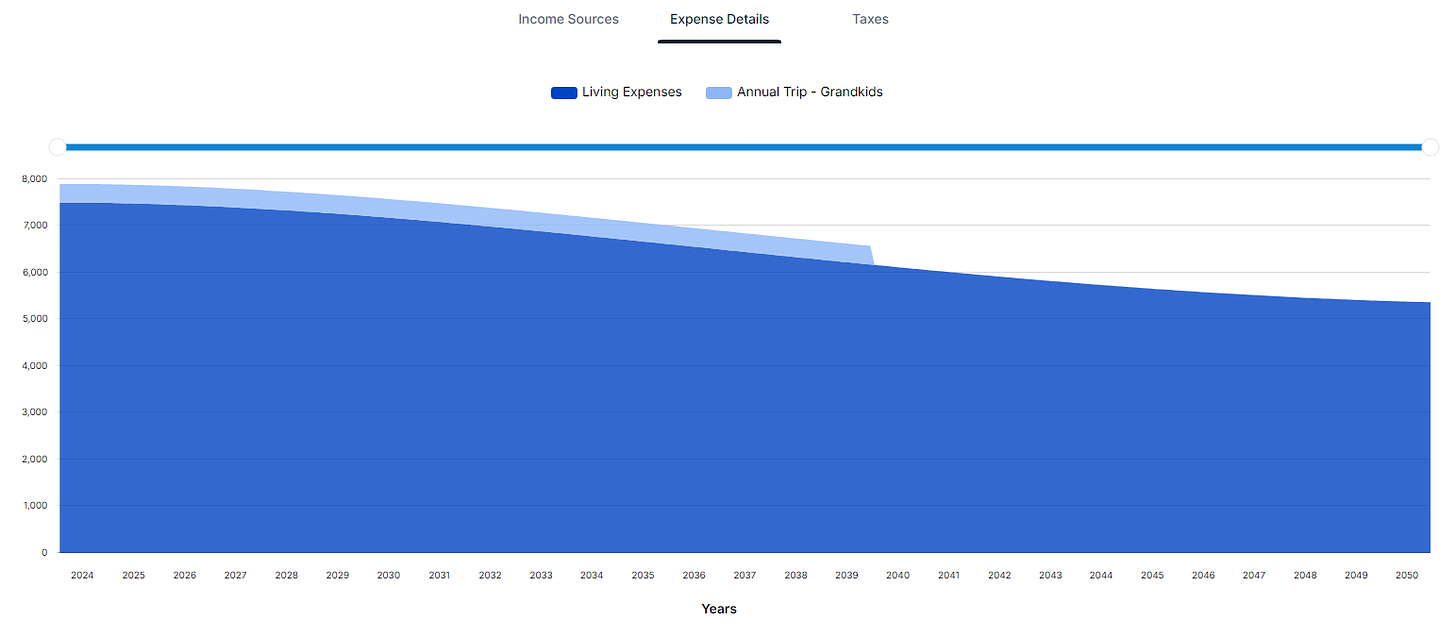
If instead of focusing on her income sources, we look at Jane’s expenses over time, we can see:
It’s a little more clear above when her annual trip expense (in light blue) stops.
You’ll also notice that Jane’s spending slowly declines over time.
This is based on the reality that spending for most folks will gradually decline over time as you become older and less mobile.
This approach to retirement spending has become known among financial planning circles as the “retirement spending smile.” Here’s a short article about it if you’re interested.
This spending assumption aligns with how many of my clients have always thought about and planned for their retirement… spending more while they’re younger and a little less as they age.
We can see this in Jane’s plan above.
While she plans to travel to see her daughter and grandkids each year for the next 15 years, she knows she won’t have the desire or the ability to do this for the rest of her life.
Or course, let’s not forget taxes.
The IRS is always lurking in the background and they’re going to want their piece of Jane’s income…
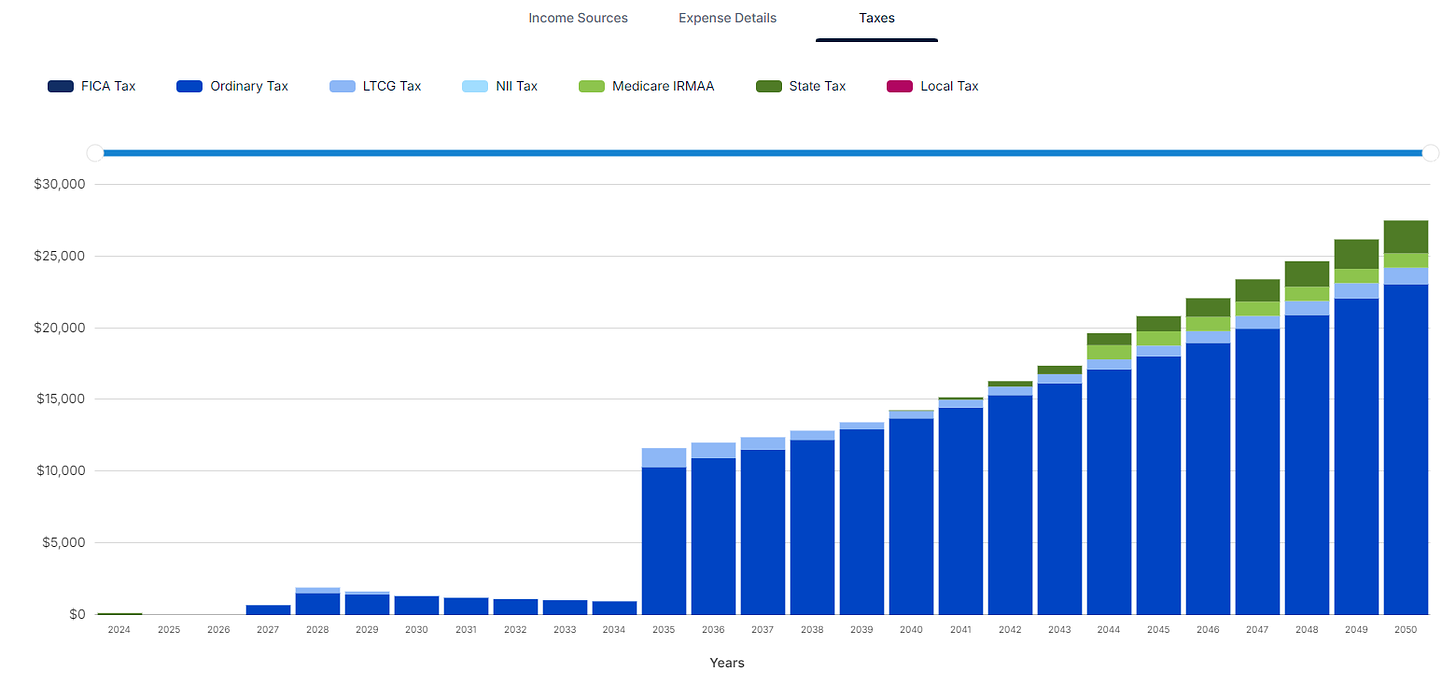
The image above is a tax projection for the rest of Jane’s life.
Of course, as with any projection of the future this won’t be accurate.
It assumes the same tax rates and rules we have today won’t change in the future.
And they absolutely will.
But it can give us an idea of how things might look from a tax perspective over the years.
While Jane’s estimated taxes will be super low for the first 10-11 years of her retirement because she’s living primarily on her taxable brokerage account and Social Security benefits, you can see that in 2035 her taxes are estimated to jump significantly.
Why?
Required minimum distributions (RMDs)… that’s why.
Based on Jane’s birthdate, she’ll have to start taking RMDs from her Schwab IRA account in the year she turns 75.
And these IRA distributions will fully taxed as income.
While beyond the scope of today’s essay, it might make sense for Jane to consider some Roth conversions during the next few years while her taxes are lower.
A Roth conversion strategy would have her convert some of her IRA assets that will eventually be subject to RMDs and income taxes to Roth IRA assets which aren’t subject to either.
Of course, these Roth conversions have a cost.
You pay income taxes today when you take money out of your IRA to convert to Roth IRA dollars.
You may or may not think that makes sense. And we may or may not pursue this strategy.
But it’s good to explore and understand your options.
I’ve written about Roth conversions before:
Just recognize that taxes and tax planning are a crucial part of retirement income planning and something I pay close attention to with my clients.
Above I mentioned the benefits of the guardrails to give us an idea of the magnitude of potential retirement income adjustments in the future.
But what about the frequency of these retirement income changes?
Will you have to make a spending adjustment every year?
Every quarter?
Every 5 years?
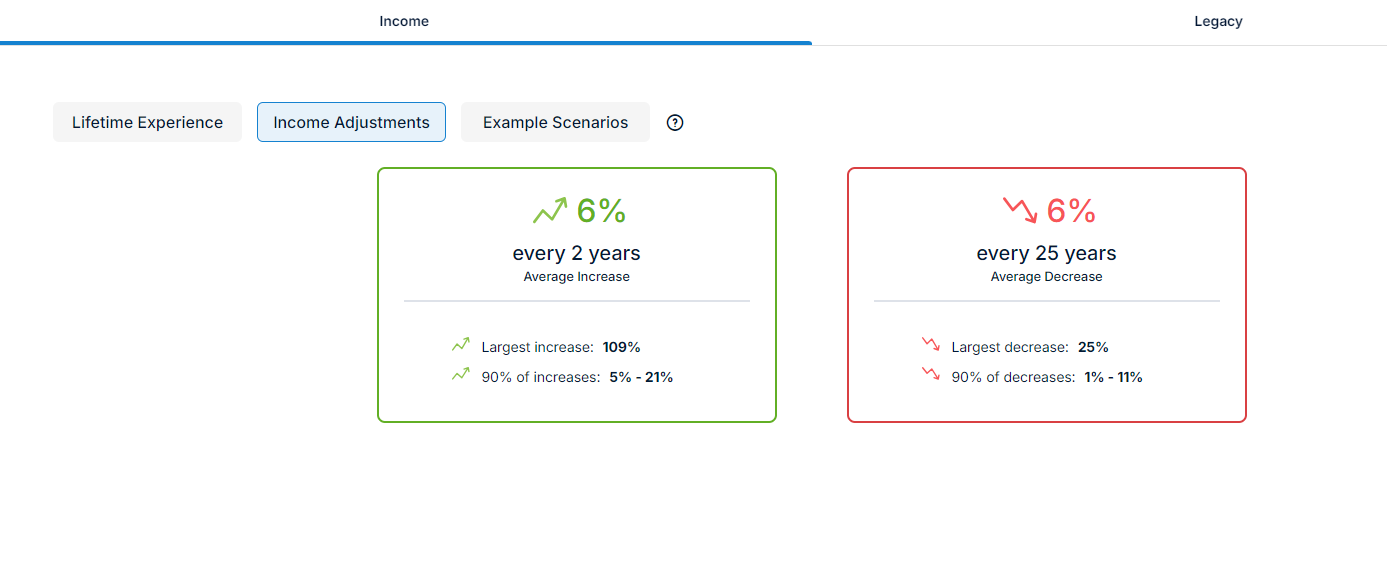
Thankfully, we have an analysis to help answer that:
The numbers above show that based on history with investment markets and inflation, Jane can reasonably expect to get a pay increase of approximately 6% every 2 years or so.
And she can expect a pay decrease of about 6% once every 25 years or so.
Once again, this is based on history.
Which means the future can and will be different. Maybe very different.
But I still think these numbers provide some helpful context to set some expectations of what we might experience.
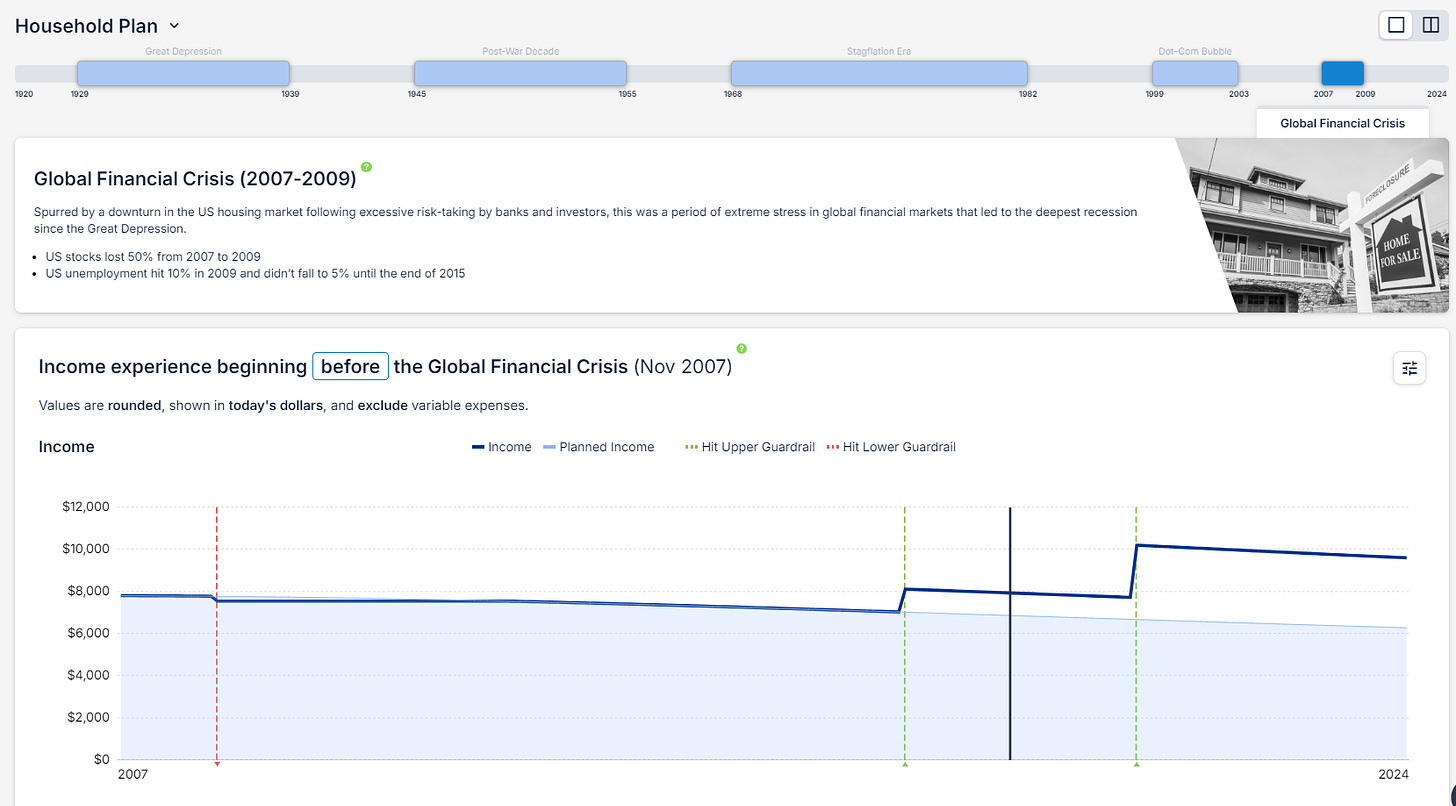
To take this idea a step further, in the image above you can see what would happen if Jane had retired in November, 2007, right before the “Global Financial Crisis.”
This illustrates when and how much her retirement income would have changed during this period in our economy.
We can apply this same analysis to the Great Depression, the post-World War 2 period, the Stagflation years, or the Dot-com Bubble periods to see how Jane’s retirement income plan would have had to adjust.
In this example, if Jane had retired in November, 2007, she would have had to take a small pay cut in February, 2009.
Later, in January, 2018, she would have been able to afford a pay raise, as you can see below.
These retirement income adjustments are based once again on the guardrails concept which you can see here:
I’ve circled each of the occasions above when Jane’s portfolio would have hit the lower or upper guardrail resulting in a change to her retirement spending capacity.
This demonstrates what her experience would have been had she retired in November, 2007, instead of retiring at the end of 2023 as she did in our case study.
There’s A LOT more to retirement income planning and I could go into much, much more detail on Jane’s case study including dozens of additional images, illustrations, and analyses.
For instance, we can go deep into tax planning by looking at Roth conversions, IRMAA brackets, taxability of Social Security, and more.
And we haven’t even scratched the surface on all the potential trade-offs and choices that Jane might consider like:
what if she starts Social Security now instead of waiting until her FRA at 67?
or what if she waits until age 70?
what if she wants to downsize her home at some point?
or move closer to her daughter?
what if she wants to leave a larger - or smaller - legacy goal?
what happens if she lives past age 90?
or if she only makes it to age 83?
what would be the impact if she does Roth conversions for the next 5 years?
the next 10 years?
or no Roth conversions?
what if, based on her additional spending capacity, she increases her baseline spending or adds some additional variable expenses?
what if she begins gifting money to her daughter (and/or grandkids) while she’s living instead of leaving money behind after she’s gone?
if Jane wasn’t already retired, what impact would the timing of her retirement have on her spending capacity?
These are just some of the virtually endless scenarios we can explore and analyze based on your personal preferences, desires, and curiosities.
Just know that once your personal retirement income plan is dialed in, things will inevitably change.
Markets go up and down, economies strengthen and weaken, interest rates change, tax legislation changes, you’ll experience changes in your life and your family’s life, and much more.
Which is why retirement income planning is not “set it and forget it.”
It’s an ongoing process where we accommodate new information into your plan as we get it and check whether or not you’re still headed in the right direction (as you define it).
While your situation will be unique and different from anyone else’s, I have the experience and tools to help you evaluate and make the most informed choices when it comes to your personal retirement income planning.
The analysis above is just one of the tools in my retirement planning toolbox.
If you have any feedback, thoughts, or questions, hit reply or leave a comment and let me know what’s on your mind.
Until next Wednesday,
Russ


