


Which 8% is best?
Average returns, actual returns, and your money

Last week I shared how average returns can be misleading.
Today I’d like to further illustrate the important difference between average returns and your actual returns.
Here’s a hypothetical investment:
You start with $750,000
You need $2,000,000 in 10 years to buy your dream home
You’re adding $25,000 per year to your investment
In year 3, you’re adding an additional $75,000
In year 5, you’re adding an additional $125,000
In year 7, you’re withdrawing $250,000
You get an 8.12% each year over the 10-year period
This means your average return is also 8.12%
And here’s what the above details look like in a spreadsheet:

Again, we’re assuming in the spreadsheet (trial 1) above that this investment has a return of 8.12% each and every year.
Highly unlikely, if not impossible.
And of course, it bears repeating that “past performance is not an indication of future results.” 😉
Keeping the details and assumptions above in mind, let’s now look at a few variations.
The following images are each a pair of the same annual returns.
But each is in a different order.
As you’ll see, your actual returns and the order in which they occur makes a difference…

Above, we have 2 side-by-side investments where each has an average 10-year return of 8.12%.
But notice the actual returns that we experience each year.
In trial 2 on the left, you see we have 7 years of positive returns (in green), then 3 years of negative returns (in red).
In trial 3 on the right, it’s the same returns, but we get the negative returns in the first 3 years.
Trial 2 fell short of the $2 million goal. And trial 3 exceeded the 10-year dollar goal by more than $250,000.
The difference between the dollar results in year 10 is more than $336,000 (highlighted in yellow).
Same average return.
Same actual returns, just in a different order.
Note: You’ll see in trial 2 on the left, that you exceeded your 10-year goal of $2 million in year 5.
That would have been a great time to put that money in the bank instead of expecting or hoping for your investment success to continue.
And ultimately falling short of your goal in year 10.
Another reason to regularly monitor your financial plan, including your investments.
This also illustrates the impact of the sequence of returns you actually experience and their impact on your actual dollar wealth.
Here’s another pair:

Once again, same investment and assumptions.
But this time, all annual investment returns are in the green.
They’re all positive.
The only difference between trials 4 and 5 is the 20% and 30% returns happen in years 1 and 2 in trial 4 and in years 6 and 7 in trial 5.
Both have the same 8.12% average return.
But this time there’s an ending dollar difference of almost $200,000.
And despite positive returns each year, trial 4 still falls short of the $2 million goal in year 10.
Reminder: average returns don’t tell the whole story!
Above we see a couple of negative 5% returns showing up in different years.
Less of an impact in the year 10 ending wealth, but a difference nevertheless.
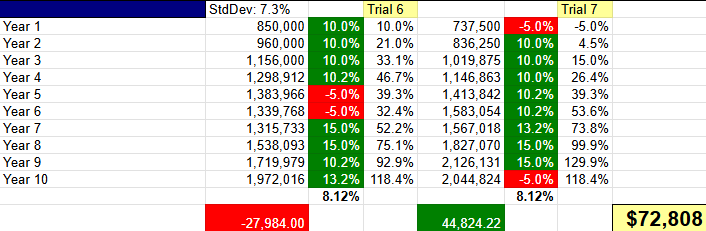
One final example:

Above, we have identical annual returns in both trials.
The sequence of returns is the same. They’re in the same order.
They’re just off by one year between the two trials.
Both once again have the same 8.12% average return.
Once again, trial 8 falls short of the year 10 dollar goal.
And trial 9 exceeds it, barely.
I hope the examples above reveal a couple of things:
Average returns get talked about a lot - in the media and by financial advisors - but they don’t mean a thing because you can’t spend average returns.
Your actual returns - and the order in which you experience them - are what matters, especially when you’re working toward a financial goal or need to create reliable income in retirement.
But here’s the thing…
You can’t control your actual returns.
No one can.
But that doesn’t mean everything is out of your control.
Far from it. (← Podcast episode from April, 2020)
However, we all have a tendency to focus on things beyond our control including investment markets and the returns they produce.
Each of the 9 trials above have an average return of 8.12%.
But which of these 8.12% returns is best?
The best return is the one that gives you the best chance at living the life you want to live.
And you know which investment portfolio gives you this “best” return?
The broadly diversified and low-cost portfolio you can stick with despite scary headlines, market ups and downs, and life “happening” around you.
And it all starts with a plan.
Your plan.
For your money AND your life.
Links & things
In addition to these weekly articles (all of which you can explore here), I’ve also been publishing some longer articles on my blog.
Here are a couple of the latest:
Thanks for reading.
Until next Wednesday,
Russ
P.S. - Thanks to my friend and colleague Mike for sharing a spreadsheet with me years ago that is the source of the screenshots above.
I love this detailed illustration of how different sequences of returns can impact your portfolio outcomes! It's a hard concept to wrap your head around but these are great examples.
"Your actual returns - and the order in which you experience them - are what matters". Thank you for this. Lesson learned! This was truly helpful. Thanks, Russ.